
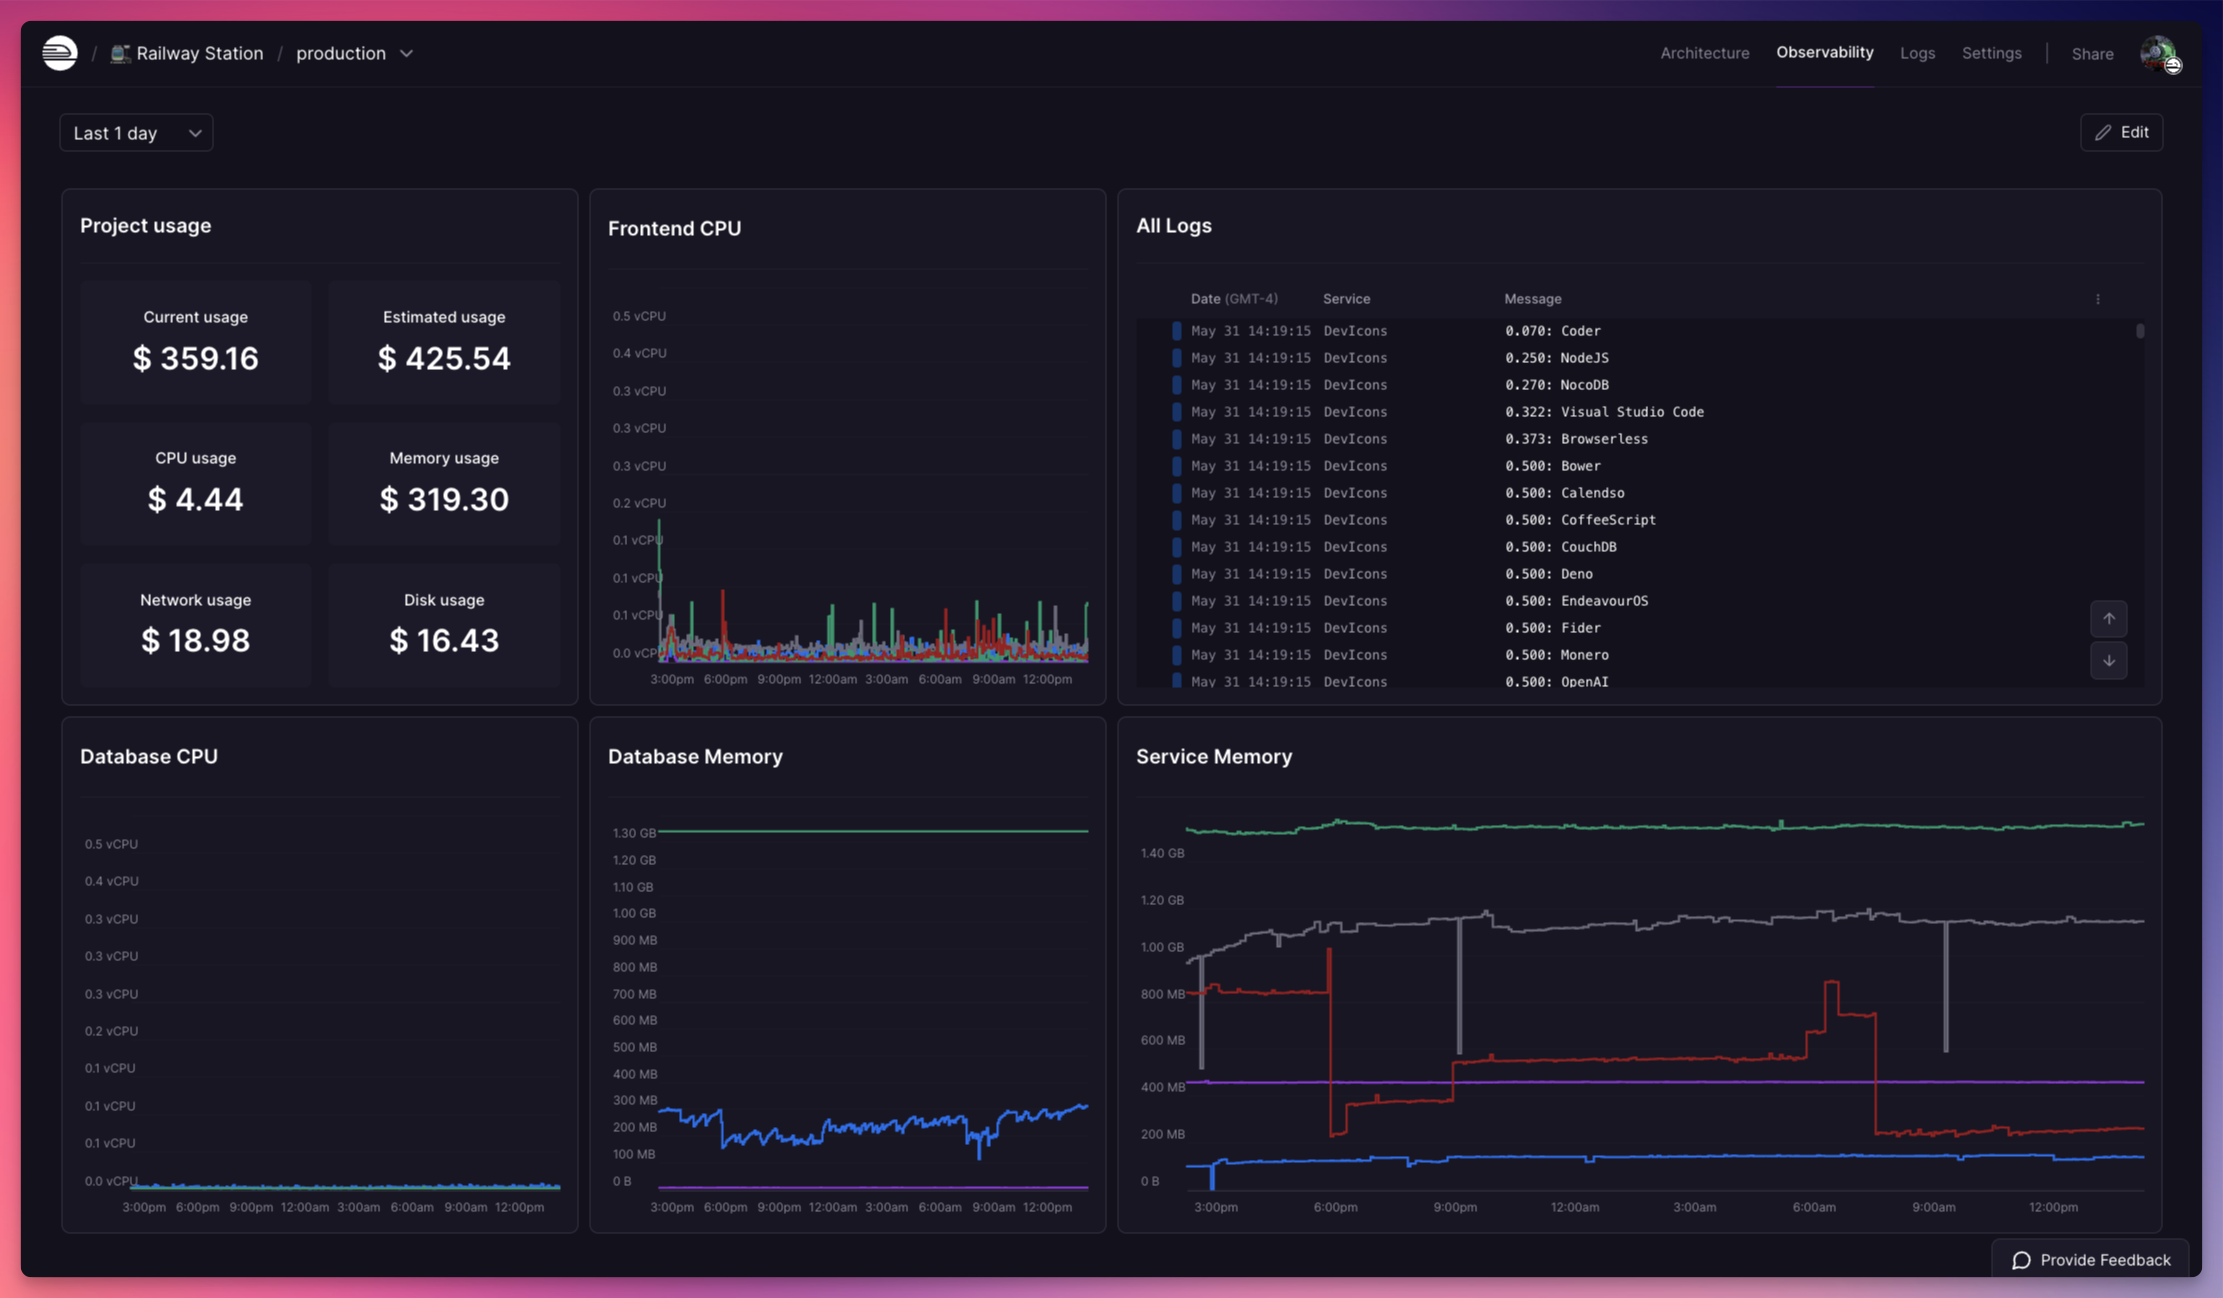
Observability Dashboard
Railway provides a built-in observability dashboard that provides a customizable view into chosen metrics, logs, and data all in one place.
Navigating to the Observability Dashboard

Users may notice that the project navigation is updated with the feature.
- Navigate to the Observability tab from the main project top bar.
- Ensure you are in the correct environment (e.g., production).
The Observability Dashboard is uniquely scoped to each project environment as services may differ between each environment.
Getting Started
By default the Observability Dashboard starts with no configured widgets.
- When you first access a new environment, you will be prompted to "Start with a simple dashboard" or "Add new item".
- Click on "Start with a simple dashboard" to create your initial layout, Railway will autogenerate graphs and widgets with spend, service metrics and logs.
Creating Widgets
Clicking "New" in the top right corner of the dashboard will open the Widget creation modal. Widget types depend on the data source provided, where they can be a graph, displayed data, or logs.

Widgets have a name and a description attached to them. By default Railway will provide a suggested name for the widget upon creation and display a preview of the content that is to be displayed on the dashboard.
Available Data Sources
On the top right, you can select a data source to display within a widget.
- CPU Usage: Track the CPU usage for various services over time.
- Memory Usage: Monitor the memory consumption for your services.
- Network In/Out: Keep track of network traffic.
- Disk Usage: Observe disk usage trends.
- Logs: Select logs from a single service or multiple services with filtering
- Project Usage: report the spend of your project and track the overall resource usage of your project.
Filtering Widget Information
When creating a widget, you can use Railway's filtering syntax to select services, select data, and perform logical negations to define rules.
<keyword>or"key phrase"→ Filter by exact text@key:value→ Filter by key/value pair- Valid keys are replica, deployment, service, plugin
@attribute:value→ Filter by custom attribute (see structured logs below)
Any of the above expressions can be combined with boolean operators AND,
OR, and - (negation).
Arranging the Dashboard
The Dashboard is customizable in content and layout. Widgets can be stacked, repositioned and resized.
Clicking the "Edit" button on the top right corner of the dashboard will transition the dashboard into edit mode, the dashboard then allows the ability to resize and reposition your widgets using the provided handle on each widget. To persist your changes, select "Save".

Resizing and Moving Widgets:
- Drag and drop items to rearrange them on the grid by dragging the arrow handle.
- Resize widgets by dragging the bottom right corner handle
Note for Small Screens: On smaller screens, items stack vertically and respect their configured height to ensure readability and usability. Editing is disabled at smaller visual breakpoints.
Editing/Deleting Widgets
Under Edit mode, each widget will have a three dot menu at the upper right corner at the bounding box of the widget. Clicking into this menu will allow you to edit the data source or delete the widget.
To persist your changes, make sure you press Save at the top right corner.
Edit this file on GitHub