
Viewing Logs
Any build or deployment logs emitted to standard output or standard error (
eg. console.log(...)) is captured by Railway to be viewed or searched later.
There are three ways to view logs in Railway.
- Build/Deploy Panel → Click on a deployment in the dashboard
- Log Explorer → Click on the Observability tab in the top navigation
- CLI → Run the
railway logscommand
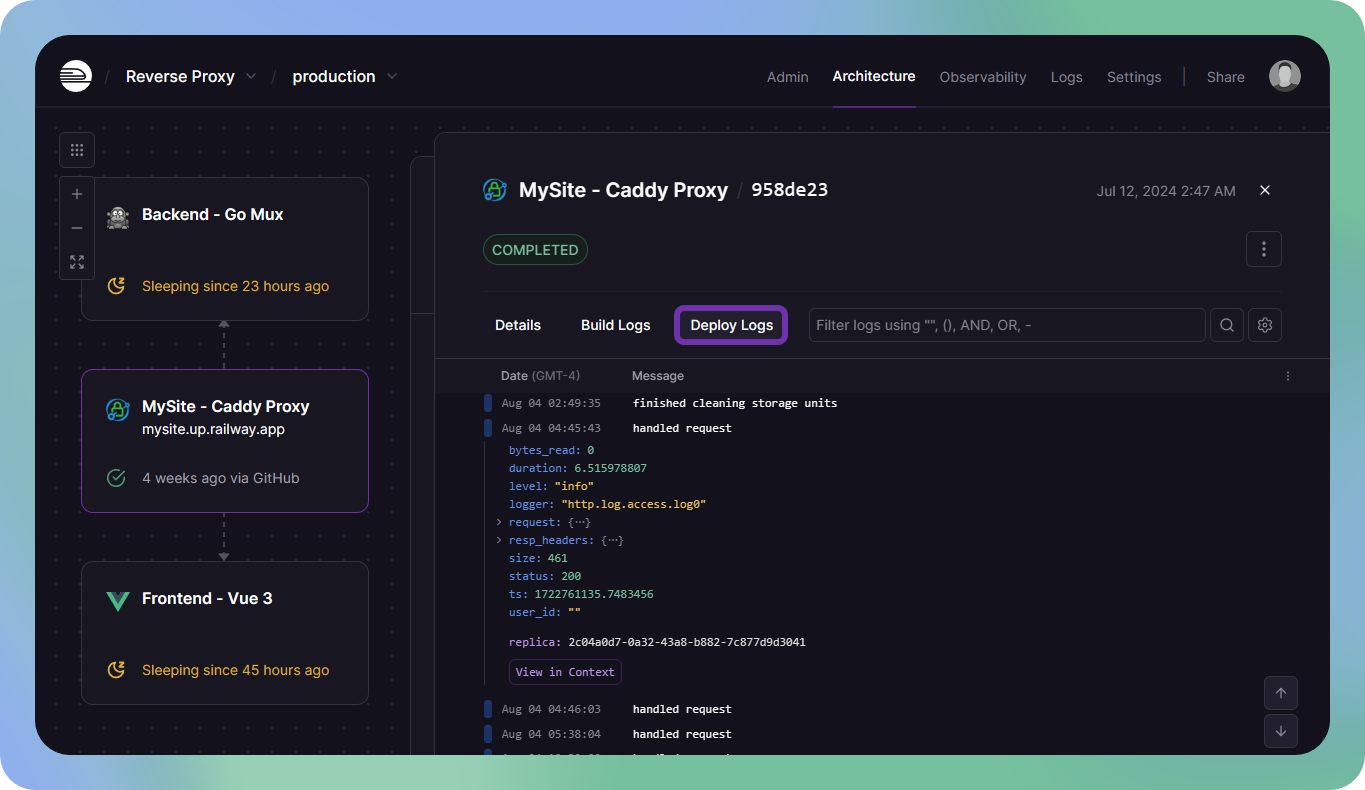
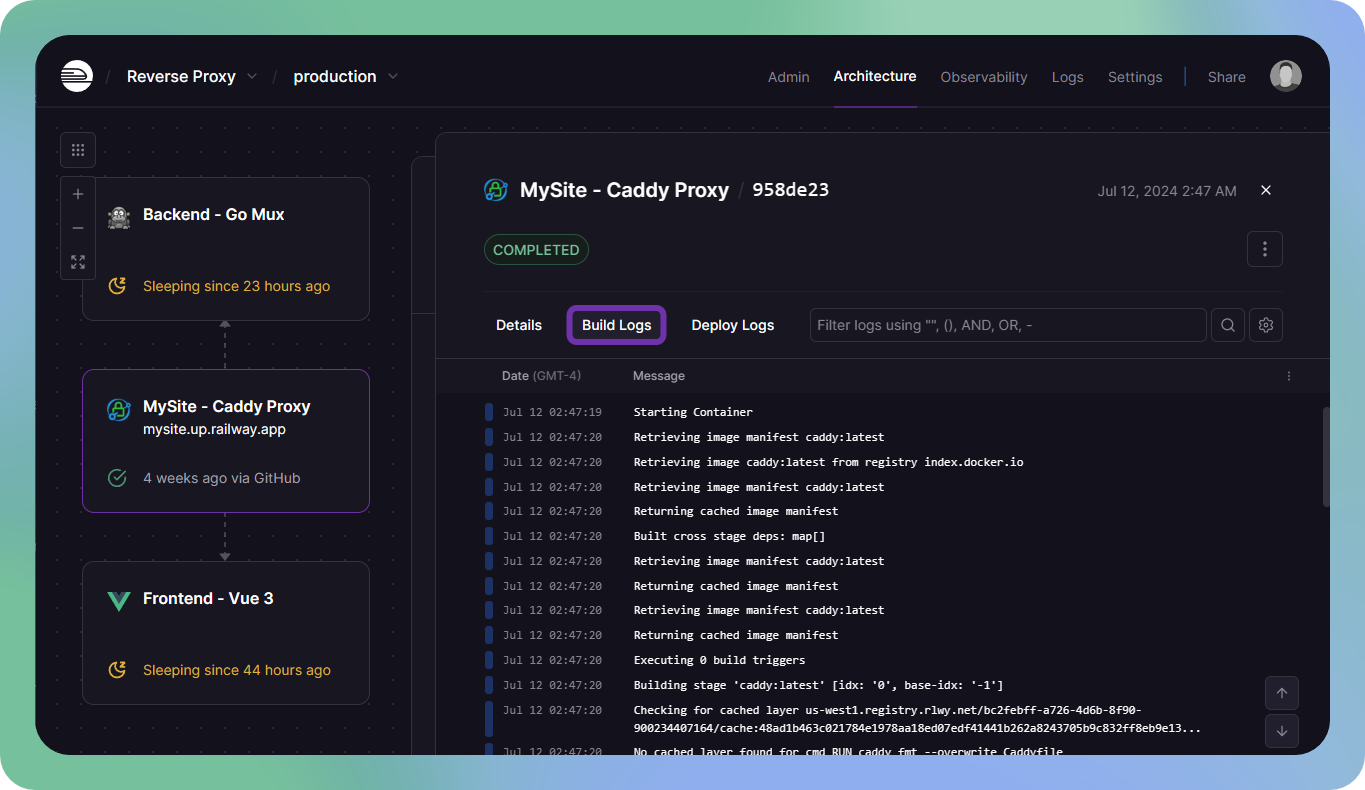
Build / Deploy Panel
Logs for a specific deployment can be viewed by clicking on the deployment in the service window, useful when debugging application failures.
Similarly, logs for a specific build can be viewed by clicking on the Build Logs tab once you have a deployment open.
Log Explorer
Logs for the entire environment can be viewed together by clicking the "Observability" button in the top navigation. The Log Explorer is useful for debugging more general problems that may span multiple services.
The log explorer also has additional features like selecting a date range or toggling the visibility of specific columns.

Command Line
Deployment logs can also be viewed from the command line to quickly check
the current status of the latest deployment. Use railway logs to view them.

Filtering Logs
Railway supports a custom filter syntax that can be used to query logs.
<keyword>or"key phrase"→ Filter by exact text@key:value→ Filter by key/value pair- Valid keys are replica, deployment, service, plugin
@attribute:value→ Filter by custom attribute (see structured logs below)
Any of the above expressions can be combined with boolean operators AND,
OR, and - (negation).
Find logs containing "error" for a specific service 👇
error AND @service:123Find all 404 errors that are NOT from a specific service 👇
(404 OR 503) AND -@service:123Find logs with a custom attribute 👇
@fullName:"first last"View In Context
Often, when searching for a log, it is useful to see the surrounding logs. To do this, either click the "Timestamp" column, or expand any log and click the "View in Context" button.

Structured Logs
Structured logs are logs emitted in a structured JSON format, useful if you want to attach custom metadata to logs or preserve multi-line logs like stack traces.
type StructuredLog = {
  // (required) The content of the log
  msg: string;

  // Severity of the log
  level: "debug" | "info" | "warn" | "error";

  // Custom attributes (query via @name:value)
  [string]: string | number | boolean | null;
}
Structured logs are best generated with a library for your language. For example, the default Winston. JSON format emits logs in the correct structure by default.
Examples
Here are a few examples of structured logs. Note that the entire log must be emitted on a single line to be parsed correctly.
{"message":"A minimal structured log"}{"level":"error","message":"Something bad happened"}{"message":"New purchase!","productId":123,"userId":456}Normalization Strategy
In order to ensure a consistent query format across Railway services, incoming logs are normalized to the above format automatically.
- Non-structured logs are converted to
{"msg":"...","level":"info"} log.messageconverted tolog.msglog.severityconverted tolog.levellog.leveldefaults toinfoif missing- Levels are lowercased and matched to the closest of
debug,info,warn,error
Edit this file on GitHub