
Deploy and Monitor a Mongo Replica Set
What is a Mongo Replica Set?
A replica set in MongoDB is a group of mongod processes that maintain the same data set. Replica sets provide redundancy and high availability, and are the basis for all production deployments.
Source: MongoDB Manual
About this Tutorial
In addition to ensuring your data layer is redundant and highly available, monitoring the data layer is key to production readiness. There are a number of ways to monitor your Mongo replica set in Railway, but this tutorial covers how to do so using popular open source tools, Prometheus and Grafana.
Objectives
In this tutorial, you will learn how to -
- Deploy a Mongo Replica Set from a Railway template
- Deploy a Python FastAPI app that connects to the replica
- Set up monitoring of the replica set with Prometheus and Grafana
Prerequisites
To be successful using this tutorial, you should already have -
- A Railway API token
- A Github account connected to Railway
- Latest version of Railway CLI installed
Most of the source code you will deploy as part of this tutorial can be found here.
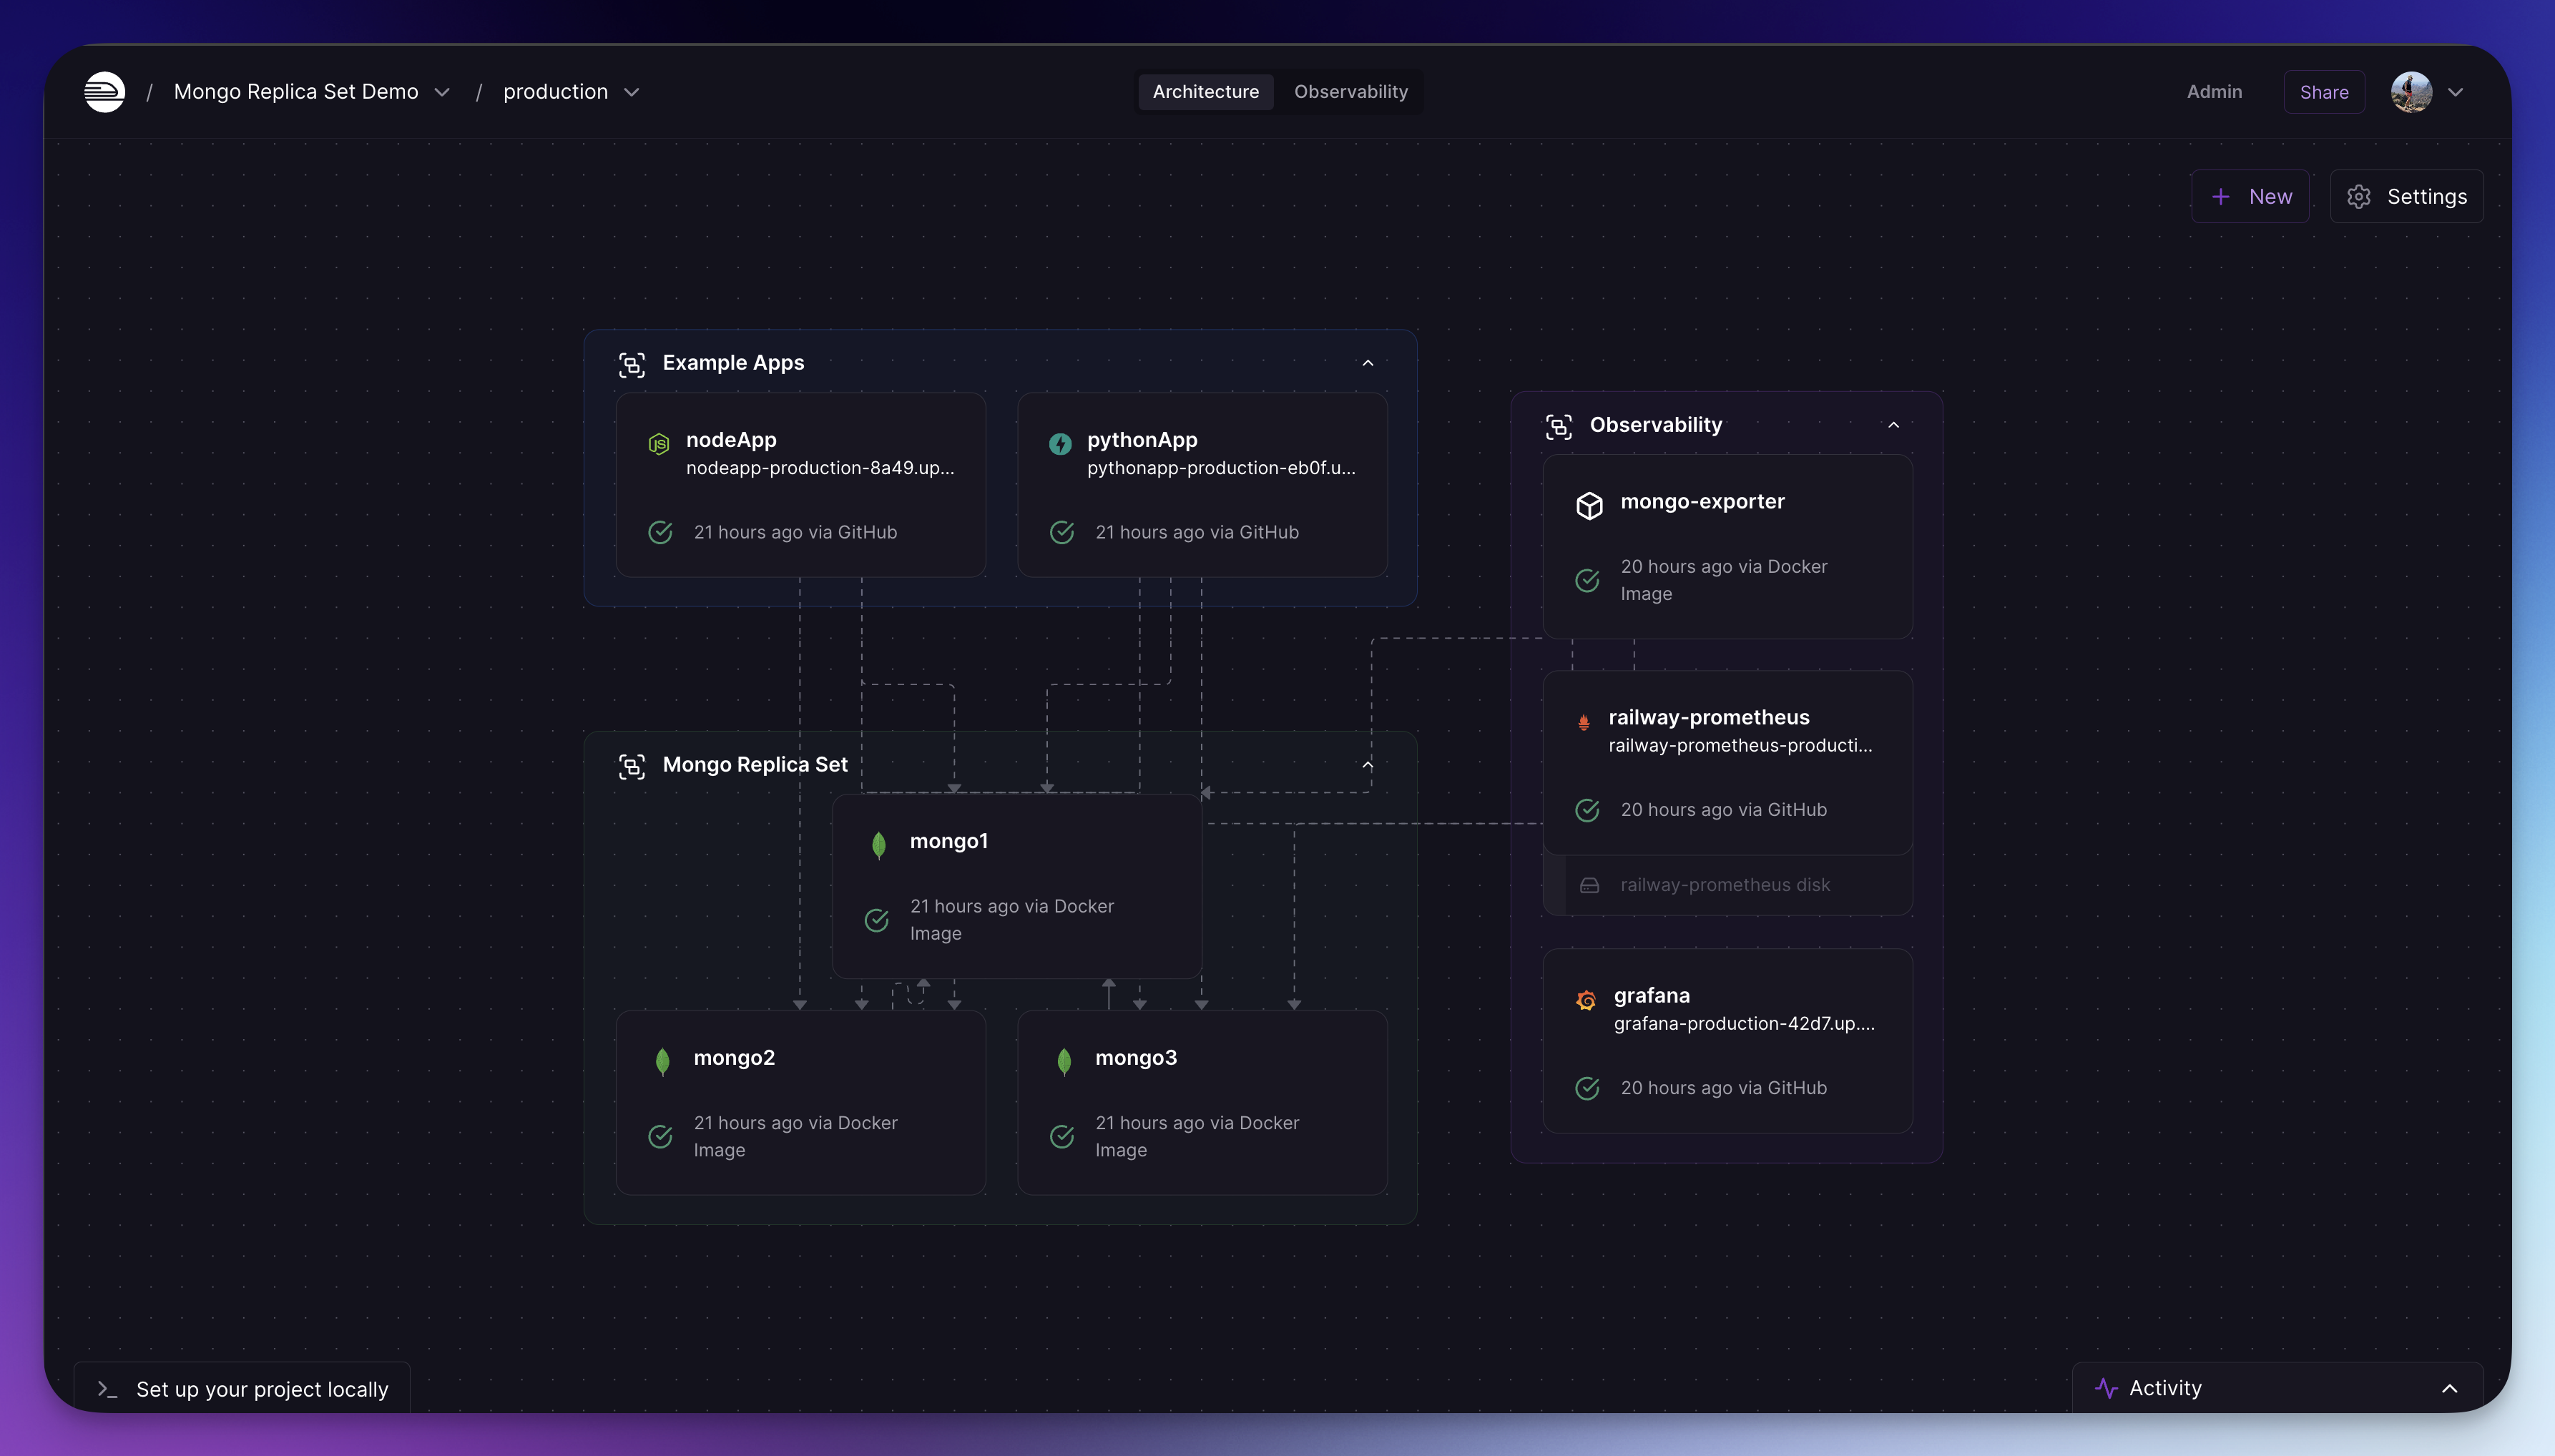
By the end of this tutorial, you will have a project similar to the one below.
Let's get started!
1. Deploy the Mongo Replica Set
This step assumes you have created a Railway API token.
First, we will deploy the Mongo replica set using the template in the Railway marketplace.
- Click here to open the deployment page for the Mongo replica set
- Click
Configurenext to the init-mongo-ha service and add your Railway API token - Click
Deploy
After clicking Deploy, you will be taken to your new project in Railway.
Note: The init-mongo-ha service is designed to be ephemeral, existing only to initiate the Mongo replica set before it is removed.
2. Deploy the Python FastAPI app
Now we'll deploy a Python FastAPI and connect it to the Mongo replica set.
Create the app locally
From your local machine -
- Create a folder for your FastAPI app called
fastApi - Within the
fastApifolder, create the following 3 files -- main.py:
from fastapi import FastAPI, HTTPException from motor.motor_asyncio import AsyncIOMotorClient import os from typing import List, Dict import random import string app = FastAPI() print(os.getenv("MONGO_URI")) # MongoDB client (motor) client = AsyncIOMotorClient(os.getenv("MONGO_URI")) db = client[os.getenv("DATABASE_NAME")] collection = db[os.getenv("COLLECTION_NAME")] def generate_random_string(length=8): letters = string.ascii_lowercase print("generated random string") return ''.join(random.choice(letters) for i in range(length)) @app.get("/") async def set_item(): random_key = generate_random_string() random_value = generate_random_string() print("sending to Mongo") result = await collection.update_one( {"key": random_key}, {"$set": {"value": random_value}}, upsert=True ) print(result) if result.upserted_id or result.modified_count: return {"status": "success", "key": random_key, "value": random_value} raise HTTPException(status_code=500, detail="Failed to set item") @app.get("/get", response_model=List[Dict[str, str]]) async def get_all_items(): cursor = collection.find({}) print("retrieving from Mongo") items = await cursor.to_list(length=None) for item in items: item['_id'] = str(item['_id']) return items @app.get("/health") async def healthcheck(): print("starting healthcheck, pulling from mongo") cursor = collection.aggregate([{'$sample': {'size': 1}}]) random_doc = await cursor.to_list(length=1) if random_doc: print("healthcheck successful") return {"status": "success", "document": random_doc[0]} else: print("No documents found") raise HTTPException(status_code=500, detail="No documents found in the collection") - Procfile:
web: uvicorn main:app --host 0.0.0.0 --port ${PORT:-5000} - requirements.txt:
fastapi
uvicorn
motor
- main.py:
Create and Configure an Empty Service in Railway
Now that you have the necessary files to run the Python FastAPI app in Railway, let's deploy it.
In the Railway project that contains your Mongo replica set -
- Add a New service by clicking
+ New - Select
Empty Service - Add the following variables to the service
COLLECTION_NAME=mycollection DATABASE_NAME=railway MONGO_HOSTS=${{mongo1.RAILWAY_PRIVATE_DOMAIN}}:27017,${{mongo2.RAILWAY_PRIVATE_DOMAIN}}:27017,${{mongo3.RAILWAY_PRIVATE_DOMAIN}}:27017 MONGO_URI=mongodb://${{MONGO_HOSTS}}/?replicaSet=${{REPLICA_SET_NAME}} REPLICA_SET_NAME=${{mongo1.REPLICA_SET_NAME}} - In the service Settings, rename the service to
fastApi - Click
Deployto apply and create the empty service - In the Settings tab, under Networking, click
Generate Domain
Deploy from the Railway CLI
This step assumes you have the latest version of the Railway CLI installed.
On your local machine -
-
Open your terminal and change directory to the
fastApifolder -
Link to the Railway project and service by running the following command -
railway linkFollow the prompts selecting the correct project name and environment (click here for a reference), and choose the
fastApiservice. -
Deploy the app by running the following command -
railway up -d
Checkpoint
Congrats! You should now have a Mongo replica set and a Python FastAPI app connected to it. Your project in Railway should look something like this -

This is a very basic implementation of the Mongo replica set, so be sure to familiarize yourself with the MongoDB documentation to understand how you might want to tailor it to your needs.
3. Test Mongo Replication
At this point, you should have a Mongo replica set running in Railway as well as a Python application connected to it.
Let's test the connection to Mongo -
- Open your
fastApiservice settings - Click on the domain to open the app in your browser
- The
/route connects to the Mongo replica set and inserts a single document
- The
- Refresh your browser a few times to add more data to Mongo
- Access the
/getroute to retrieve all of the documents you have just added
Now let's perform some chaos engineering to ensure Mongo replication is working -
- Open the
mongo1service settings - Open the three-dot menu on the active deployment and click
Removeto remove the deployment - Access the Python app's
/getroute to confirm it continues working
You can also check out the Mongo logs for detection of node failure and leader elections!
4. Set up Monitoring of the Replica Set
Finally, let's set up some monitoring so you can keep track of the health of your replica set.
Add the Mongo Exporter Service
There are various ways you could retrieve metrics data from the Mongo instances, but we'll use the MongoDB exporter provided by Percona.
- Add a New service by clicking
+ Newin your Railway project - Select
Docker Imageas the Source - Add 'percona/mongodb_exporter:0.40.0' and hit Enter
- In the service Settings, rename the service to
mongo-exporter - In the service Variables, add the following -
MONGO_HOSTS=${{mongo1.RAILWAY_PRIVATE_DOMAIN}}:27017,${{mongo2.RAILWAY_PRIVATE_DOMAIN}}:27017,${{mongo3.RAILWAY_PRIVATE_DOMAIN}}:27017 REPLICA_SET_NAME=${{ mongo1.REPLICA_SET_NAME }} MONGODB_URI_SINGLE=mongodb://${{mongo1.RAILWAY_PRIVATE_DOMAIN}}:27017 MONGODB_URI=mongodb://${{MONGO_HOSTS}}/?replicaSet=${{REPLICA_SET_NAME}} PORT=9216 RAILWAY_BETA_ENABLE_RUNTIME_V2=1 - In the service Settings, add the following Start Command -
/mongodb_exporter --log.level="debug" --collect-all - Click
Deploy
This service will connect to the MongoDB and retrieve various metrics. It makes those metrics available on a /metrics route which Prometheus will use to retrieve them.
Add the Prometheus Service
- Add a New service by clicking
+ New - Select
Templateas the Source - Type Prometheus, and select the Prometheus template (be sure to select this one)
- Click
Deploy Templateto apply and deploy the service
Now we need to configure Prometheus to scrape metrics from the exporter.
- In the service Settings, eject from the Upstream Repo by clicking the
Ejectbutton - Choose your Github organization
- Click
Eject Service - Open the repository that was created for you in Github
- Navigate to the
prometheus.ymlfile - Click the pencil icon to edit in place, and add the following job -
Note: If you find that the exporter is not retrieving data from Mongo as expected, confirm the internal domain in the Service Settings
- job_name: 'mongodb' static_configs: - targets: ['mongo-exporter.railway.internal:9216'] - Click
Committo commit the changes and redeploy the service in Railway
Add the Grafana Service
- Add a New service by clicking
+ New - Select
Templateas the Source - Type Grafana, and select the Grafana template
- Configure the required variables to your liking
- Click
Save Config - Click
Deployto apply and deploy the service
Once Grafana is up and running, let's connect it to Prometheus.
- Access Grafana by clicking on the domain from the service settings
- Login with the credentials you configured in the steps above (If you forgot the credentials, you can access them from the service variables tab).
- Click on the hamburger menu in the top left-hand corner
- Expand Connections
- Click Data Sources
- Click Add Data Source
- Find and click Prometheus
- In the Connection section, add the following Prometheus server URL -
http://railway-prometheus.railway.internal:9090 - Scroll down to the bottom and click
Save & test
Grafana is now set up to retrieve data from Prometheus! Let's add a dashboard to visualize the MongoDB data.
- Click on the hamburger menu in the top left-hand corner
- Click Dashboards
- Click Create Dashboard
- Click Import Dashboard
- Copy the dashboard.json from the template repo
- Paste the json into the input box and click Load
- Select the prometheus data source and click Import
Nice! You should have a dashboard now that looks something like this -

Conclusion
Congratulations! You have deployed a Mongo replica set, connected a Python FastAPI, and set up monitoring of the replica set using Prometheus and Grafana.
Hopefully you have learned something new or at least gotten a start on implementing your own application stack with Mongo as your highly available, redundant database.
Note that is a very basic implementation, and you should refer to the MongoDB, Prometheus, and Grafana documentation for information on how to customize your implementation.
Edit this file on GitHub