
Viewing Metrics
Railway provides resource usage information on deployments within a service which can be used to diagnose issues with a project's performance.
Accessing Service Metrics
Access a service's metrics by clicking on a service in the project canvas, and going to the "Metrics" tab.

The following metrics are provided:
- CPU
- Memory
- Disk Usage
- Network
Understanding the Metrics Graphs
Graphs include white lines to indicate when new deployments began. Only the past 7 days of data is available for each project.
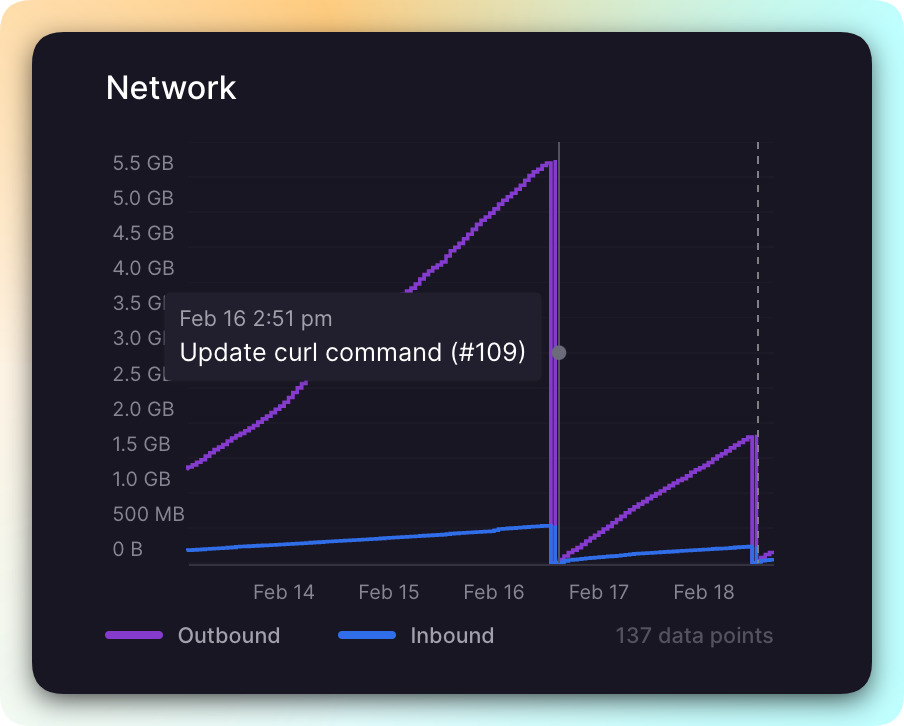
Projects maintain a continuous time-series for all deployments within a service, not just the latest one. Deployments appear on the graph so users can see which commit may have caused a spike in resources.
Edit this file on GitHub